
Separate two different outcomes
Settling rate describes movement of an interface or floc population. Overflow clarity describes residual fines. A dose that produces fast large aggregates can still leave dispersed ultrafines, while a slower condition may deliver cleaner water.
State how and when each measurement is taken so results are comparable.
Use a consistent cylinder method
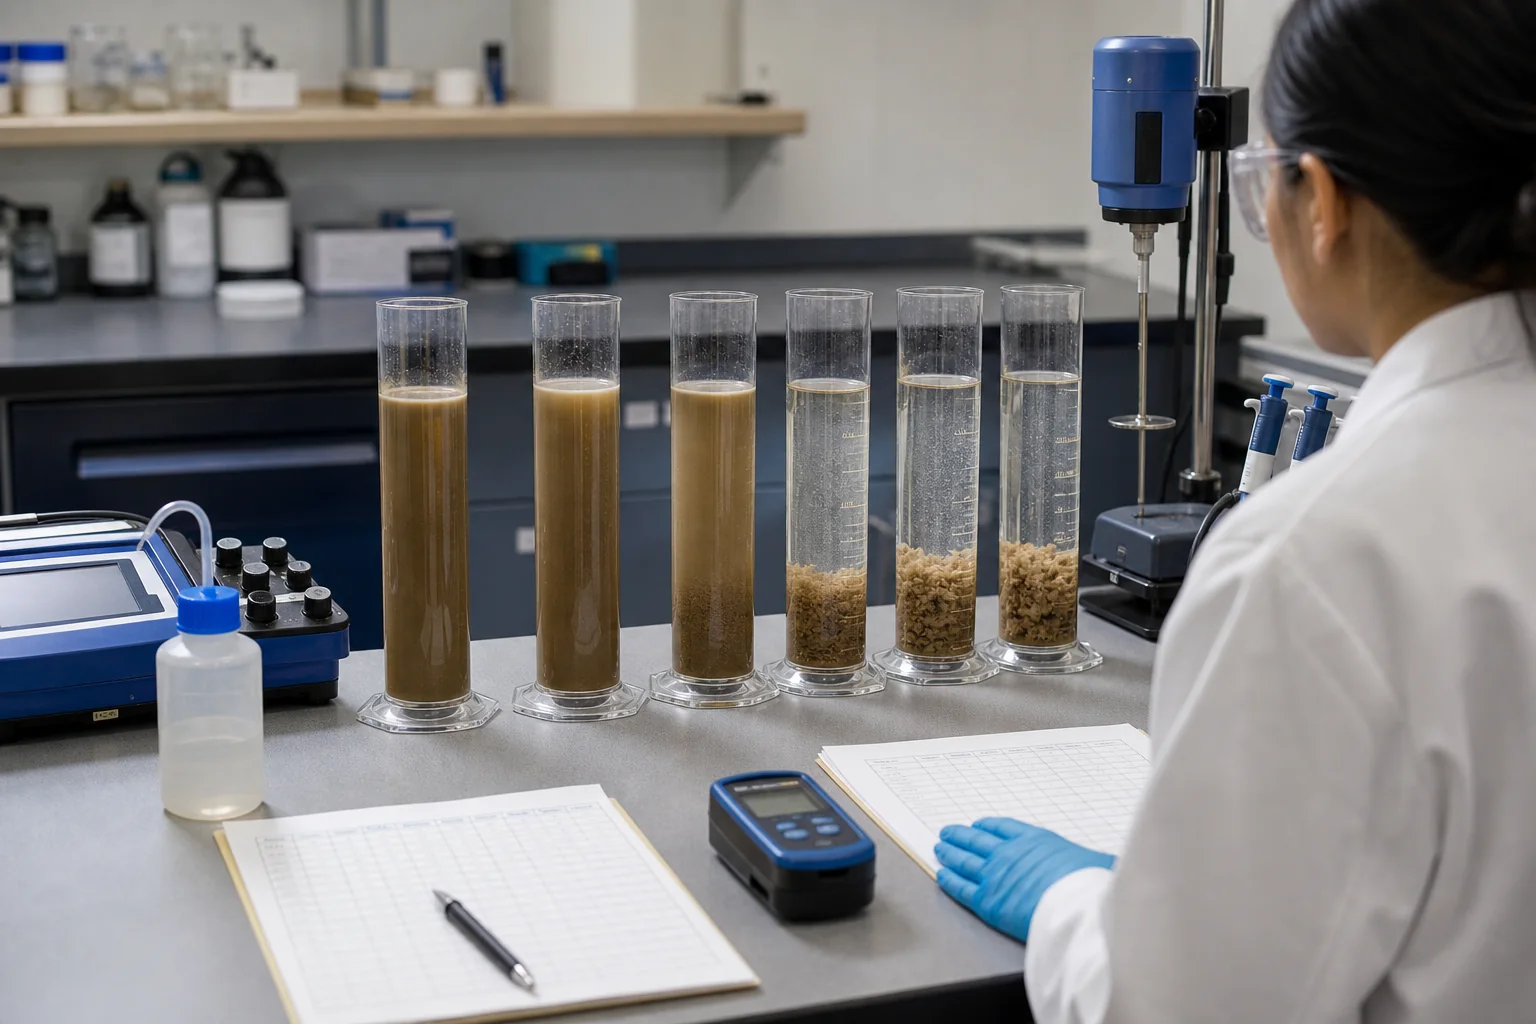
Keep cylinder geometry, sample volume, temperature, mixing and observation times fixed. Mark interface height at planned intervals and sample supernatant from the same depth without disturbing the bed.
Include blanks and repeat the useful conditions. Wall effects and inconsistent inversion can create false precision.
Add compacted volume
Record settled-bed height or solids concentration after a defined time. Open, water-rich floc can settle quickly and occupy excessive volume, limiting thickener capacity or sludge handling.
Where possible, test filtration or underflow rheology after settling rather than assuming a small-looking bed will pump well.
Challenge floc strength
Apply a defined additional mix or shear and observe breakage and recovery. The strongest initial visual response may not survive a pump, feedwell or transfer line.
Keep the challenge identical across products and avoid hand-shaking jars with uncontrolled intensity.
Locate overdose
Extend the curve beyond the first useful result. Rising turbidity, unstable interface, slimy aggregates or greater bed volume at high dose can reveal restabilization, distribution problems or water retention.
Move back down the active-dose curve before requesting a stronger grade.
Choose the plant-weighted balance
Weight settling, clarity and compaction according to the plant bottleneck. Verify the candidates at realistic solids flux and full process residence.
Report the selected window with feed condition, grade, lot, stock preparation, active dose and measurement method. The numbers are meaningful only with that context.
Choose observation times before the test
Use short intervals during the initial interface movement and longer intervals as the bed compacts. Select a clarity sampling time relevant to plant residence. Changing the observation time after seeing the curves favors whichever product develops fastest.
Photograph cylinders from the same position and lighting only as supporting evidence. Use measured interface height and turbidity or suspended solids for the decision.
Separate discrete settling from zone settling
Dilute suspensions may show individual aggregates falling through clear water, while concentrated feeds develop a moving blanket interface. State which behavior is present and avoid applying one velocity calculation to a changing regime.
For high-solids slurry, record hindered settling and compression behavior. The early slope alone may not predict thickener bed response.
Sample supernatant without disturbing fines
Use a fixed sampling depth and gentle withdrawal. Avoid drawing from the surface in one cylinder and near the interface in another. Rinse and condition the sampling device so retained polymer or solids do not transfer between tests.
Measure turbidity within the instrument range and use dilution only with a documented method. For process control, suspended solids may be more meaningful than optical turbidity where particle color changes.
Interpret a fast but dirty result
Fast settling with poor clarity often indicates selective capture of coarse particles, weak attachment of ultrafines, floc breakage or excessive local dose. Review particle distribution, water chemistry and mixing before moving automatically to a higher molecular profile.
Test an adjacent charge profile, improved dilution or a primary destabilization step where the process permits. Keep the original rate endpoint so a clarity improvement does not create an unacceptable throughput loss.
Interpret a clean but bulky result
Clean supernatant with a large, slow-compacting bed can indicate open floc that holds water. Measure bed height over longer time, drainage or filtration, and underflow handling. A thickener may run out of inventory volume even though its overflow remains clear.
Use the plant constraint to weight the decision. Select the dose and profile that meet clarity while maintaining workable compaction, pumping and downstream dewatering.
Plot the full response instead of one point
Graph settling rate, turbidity and compacted volume against active dose for every candidate. Mark repeats and the current product. A visual curve shows whether the useful region is broad, whether clarity improves after rate plateaus, and where high dose begins to reverse the response.
Keep raw observations with the graph. Smoothing or composite scores should not hide a measurement that exceeds the plant limit.
Verify the weighted decision at scale
Take the two most useful bench conditions to a controlled plant trial. Hold separator settings, dilution and feed as steady as practical, then wait through residence. Collect matched overflow and underflow or sludge data and record throughput.
If the plant result reverses the cylinder choice, investigate mixing, shear, solids flux and sampling before discarding the bench method. Update the method so the next screen reproduces the process more closely.