
Define the separation task
State whether the process needs clarification, thickening, filtration, recycle-water control or erosion-related sediment capture. Record the separator and the measurement that limits production. The same suspension can require a different floc structure when equipment or endpoint changes.
Keep rate and quality together. Settling velocity without overflow clarity, or capture without compacted volume, can select a product that shifts the problem downstream.
Characterize the solids
Record source, mineral or process type, particle-size distribution, solids concentration and density. Note clay fraction, fresh fracture surfaces, organic contamination and upstream reagents. These details help explain adsorption and bridging behavior.
Split a well-mixed representative sample. If coarse solids settle before dosing, each cylinder receives a different feed and the comparison loses meaning.
Characterize the liquid
Measure pH, conductivity, hardness, temperature and relevant dissolved ions. Use the actual process or recycle water for preparation where feasible. Polymer conformation and particle interaction can change when multivalent ions or salinity move.
Repeat finalists on normal and difficult water. A product qualified only in deionized laboratory water has not been qualified for the plant.
Choose an interpretable candidate set
Select adjacent molecular and anionic profiles so the comparison answers a question. If both variables change widely, describe the candidates by code and measured result instead of claiming one property caused the outcome.
Request the supplier's reporting method for charge or hydrolysis and molecular indicators. Nominal values from different methods are not automatically equivalent.
Run an equal-active-dose curve
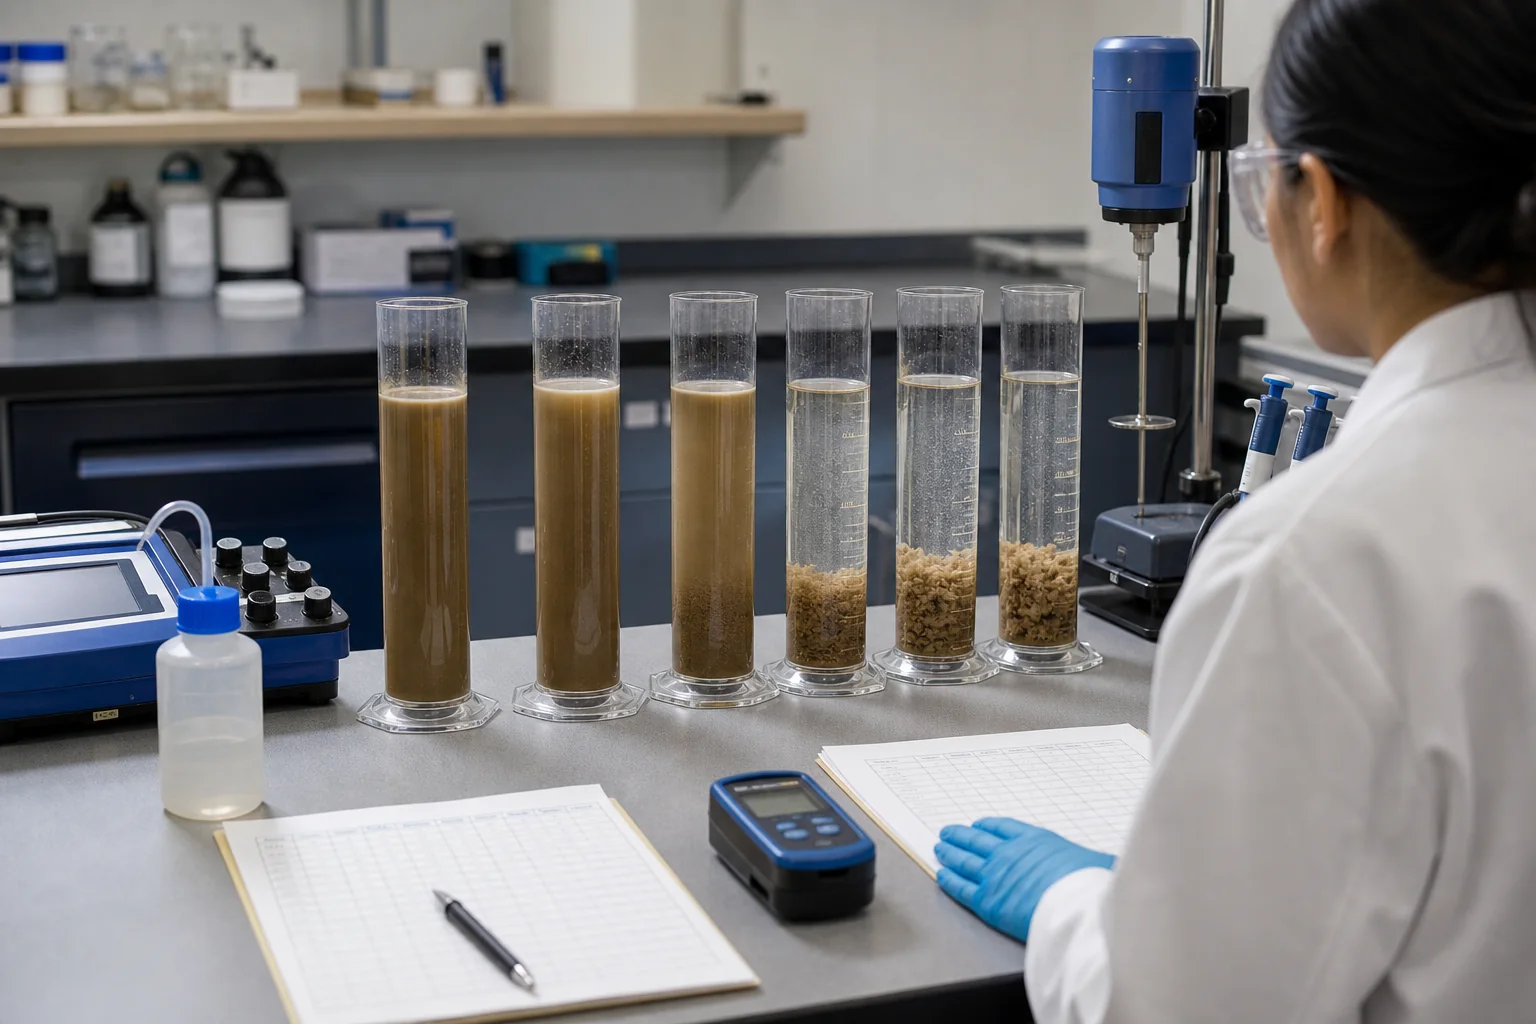
Prepare candidates with identical water, concentration, wetting, maturation and stock age. Test blank, current product, underdose, middle points and a high point. Apply consistent rapid contact and gentle floc growth.
Measure floc growth, defined-shear recovery, settling interface, supernatant turbidity, compacted volume and relevant filtration. Repeat the useful band rather than selecting one lucky jar.
Scale the operating window
Carry grade, lot, active dose, dilution, injection and mixing into the plant. Hold equipment settings while the initial product comparison runs, wait through process residence and collect matched feed and output samples.
Approve a middle range that remains controllable through expected feed variation. Compare product mass, throughput, water recovery and sludge handling as a combined delivered cost.
Design a representative sampling plan
Collect across the period that creates the selection problem rather than taking only the easiest operating hour. For a quarry or mineral circuit, note ore source, cyclone or screen condition, recycle ratio and recent reagent changes. For coagulated wastewater, record raw-water demand and primary coagulant control.
Use clean containers with enough volume for every candidate, blank and repeat. Keep the sample gently mixed while aliquots are divided, then test within a documented time. Temperature change, settling and continued chemical reactions can move the response between collection and the bench.
Prepare candidates without creating a hidden variable
Use one make-down water, active concentration, induction method, maturation time and solution age. Label each stock with grade, lot, start time and calculated active basis. Inspect for fisheyes or screen residue before a weak result is assigned to product chemistry.
Calibrate pipettes, syringes or dosing pumps over the volume range used. When a highly viscous stock cannot be delivered accurately, prepare a justified lower concentration and adjust every candidate to the same active mass.
Convert observations into an acceptance table
Set minimum clarified-water quality, acceptable settling or filtration rate, maximum settled volume and required shear recovery before viewing the final results. Add operational constraints such as pumpability, feeder range, available aging time and downstream water-balance limits.
Score each condition against the same table and retain the raw measurements. A weighted decision makes tradeoffs visible: one grade may settle faster, another may produce cleaner overflow, and a third may remain stable over a broader dose range.
Diagnose a flat or contradictory test
When no candidate works, confirm that the suspension is actually destabilized enough for bridging and that the water supports adsorption. Recheck dose units, stock maturity, mixing order and sample split. Compare with a primary coagulant step only when the process allows one.
When every candidate appears excellent, reduce dose and increase measurement sensitivity. Extremely high starting doses can hide meaningful differences and create a plant setpoint that is expensive or vulnerable to restabilization.
Write the plant-trial release record
List finalists, sample lot, active-dose band, preparation, dilution, proposed injection and required residence. Define which equipment settings remain fixed, the order of trial steps, sampling locations and the minimum duration after each change.
Assign stop criteria for cloudy overflow, rising rake torque, unstable sludge withdrawal or another process risk. A successful release states the chosen product and operating range, but also records the feed envelope in which that decision remains valid.